All Chart Patterns, measured.
Thirty years. All S&P500 companies.
Most patterns fail. A few beat the market.
Find out which, and whether one is forming in the stock you are watching.


You were taught to see shapes. Nobody taught you to count them.
Somewhere along the way you learned that a hammer at the bottom of a fall means the buyers stepped in. That a death cross means trouble is coming. That a head and shoulders breaks down.
You learned it from a book, or a video, or a person who learned it exactly the same way.
Nobody has ever checked.
The claim survives because it sounds right, and because there is always a chart somewhere where it worked.
I know how that goes. I spent years trading on inherited certainty, with an analysis I was proud of, watching the account go down anyway.
Poker taught me this, and no trading book did.
Not the bluffing. The folding. A good player throws away most hands without a second thought and waits, because the money is not made by playing well. It is made by only playing when the cards are worth playing.
Charts work the same way, and nobody trades them that way.
Most days the market deals you nothing. A shape appears, it looks like the one in the textbook, and it is worth exactly what a random day is worth. A few times a month it deals you something unique, a pair of ACEs.
Telling those two apart is our job.
We take a pattern exactly as it is taught and write it down in code, so it cannot quietly change shape to fit the result. We run it across every company in the S&P 500, every day, for 30 years.
Then we ask one question.
Does the pattern beat the Index?
Not “did it go up”.
Almost everything goes up in a rising market, and then everybody congratulates themselves on their timing. The index is the par of this table.
Beat the par or you were never playing, you were just sitting there while the pot grew.
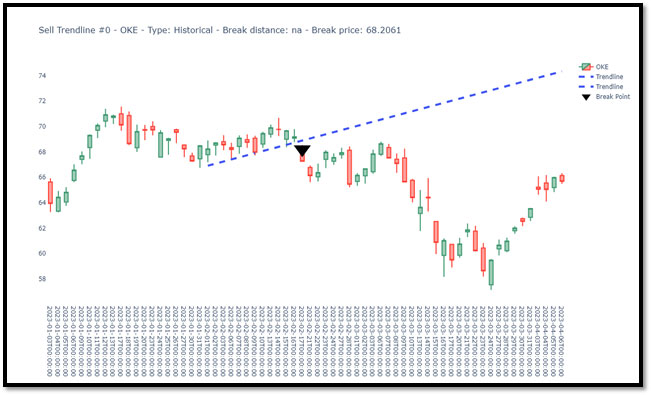
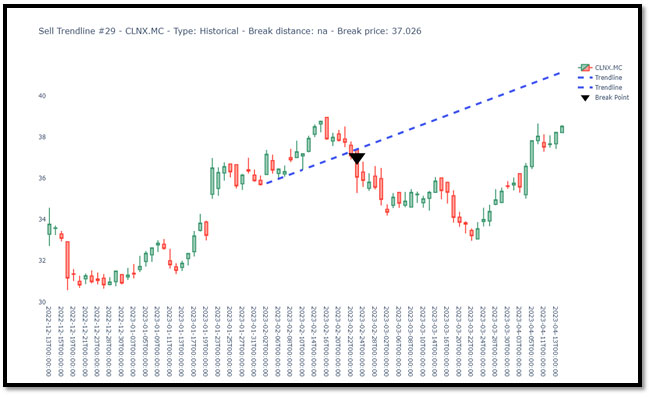
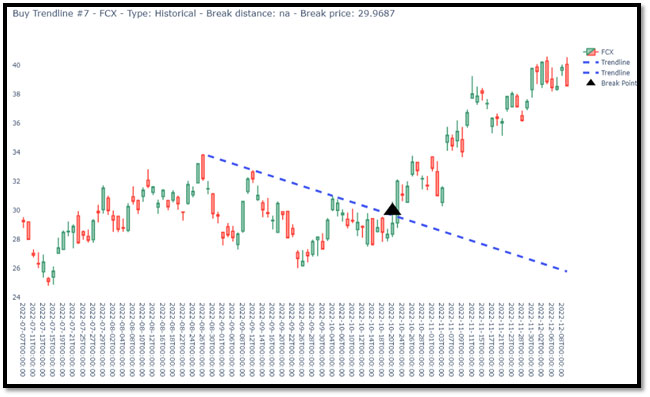
Example of Chart Patterns based on Trendlines
The images below are screenshots showcasing the behavior of previous chart patterns following a breakout. Both buy and sell patterns are represented. The charts display only the break line (blue dots) and the breakout price (black triangle), without detailing the pattern that triggered the breakout.